Most local business owners check their Google ranking by going to Google Search and entering a high-volume search query, such as "auto repair," relevant to their business, at their business location.
If you see your business ranking high, you are satisfied and move on to more significant tasks.
If the business was located in an affluent area and the ideal customers lived nearby, this method would be great for checking your Google search performance. However, most of the brick-and-mortar businesses are NOT located in the same neighborhood as their best customers, primarily for cost or zoning reasons.
What easy-to-conduct methods are available to local business owners to determine their Google search performance in the most attractive nieghborhoods?
In essence, there are three.
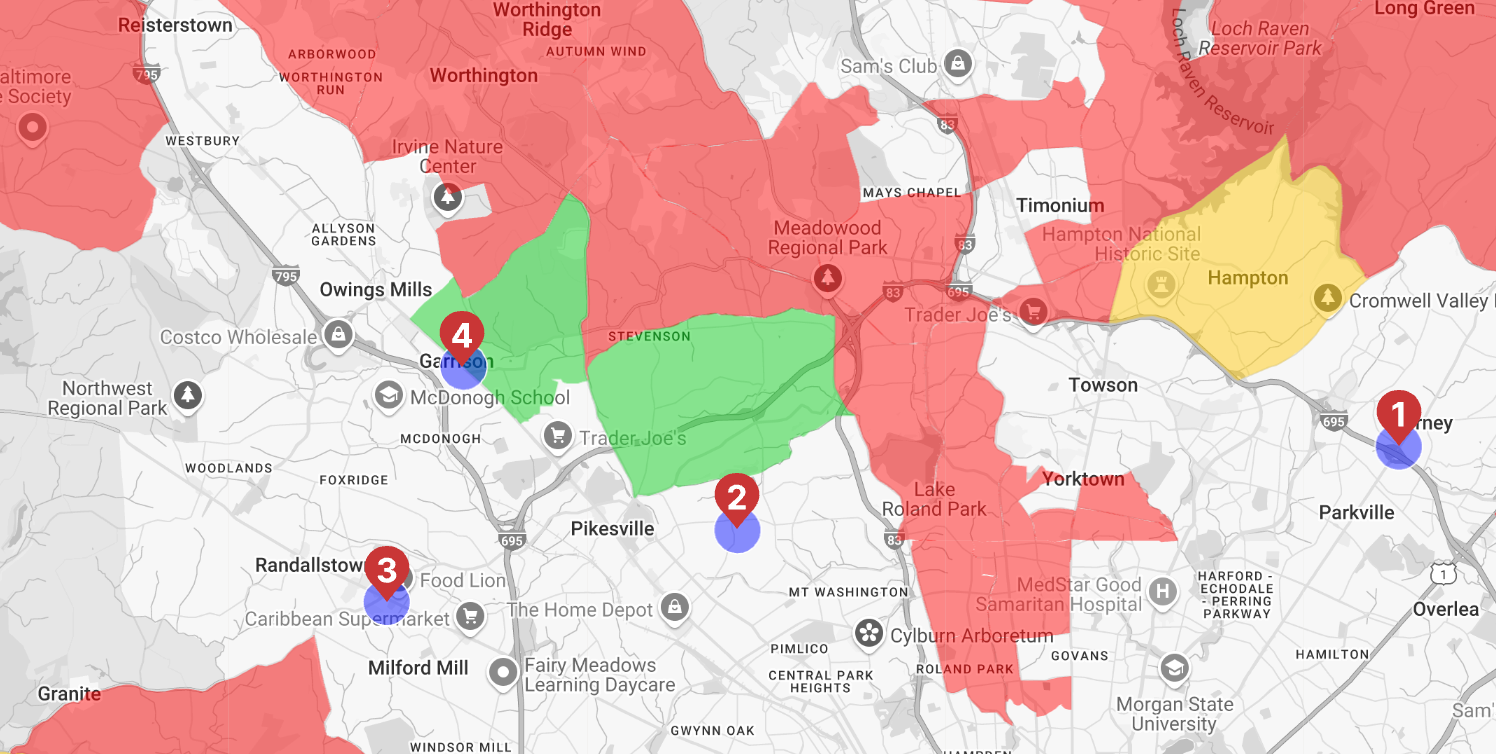
- Run a BizMapIQ.com search for a high-volume search query and use a filter to show only neighborhoods with a median household income describing an affluent socioeconomic area. If the areas around the business location are not green, SEO measures must be taken to improve the ranking of the Google Business Profile and website. The image below represents a 4-location business; the neighborhoods shown feature $133k+ median household income households.

It is obvious that- The locations of the businesses are in lower median income areas than $133k, and
- A high potential to market to affluent neighborhoods through the web presence and postcards is available.
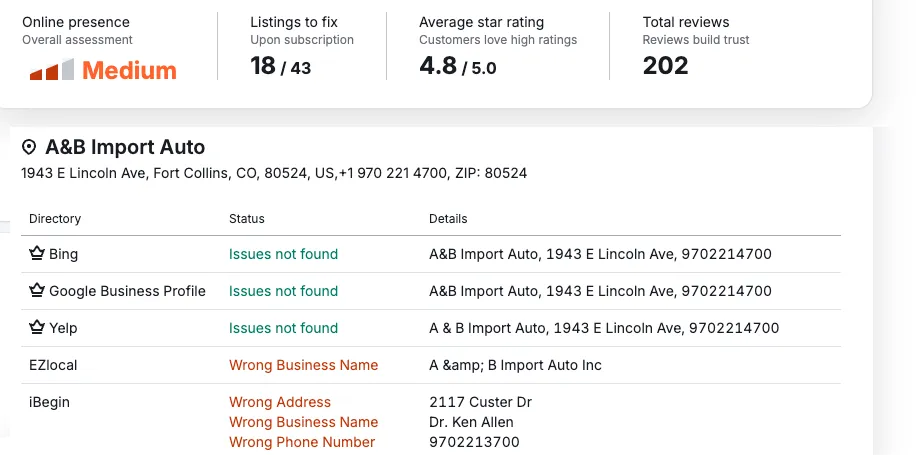
- Checking the so-called NAP integrity (Name, Address, Phone Number) makes it easy to check whether the GBP is known enough to rank. This link allows you to do it at no cost. The result might look like the image below. Get with your website provider to fix it, or sign up for a service like Yext to take care of it.

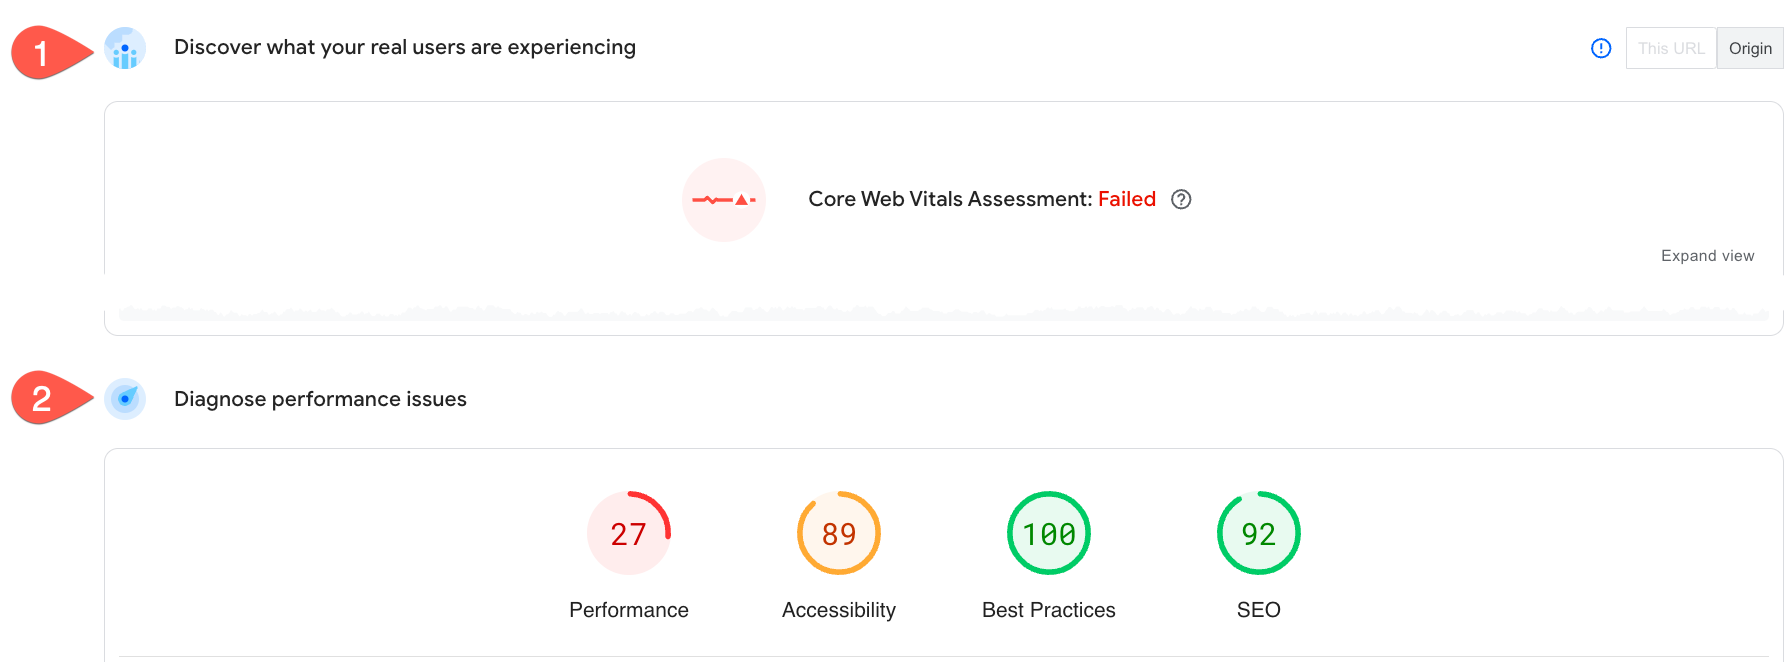
- Checking the so-called Core Web Vitals. Introduced by Google in 2020, it measures how well a website creates the user's first impression. Also known as the Lighthouse score, you can use this link to measure these metrics for your website. An example is shown below. It is split into two portions:
- The real-life user experience: this metric measures the traffic of real users for the last 28 days. Note that single-location businesses often don't have enough traffic for this metric to be displayed. The image below indicates there is work to be done.
- The 'lab' metrics simulated a phone with throttled cellular data speed to account for older smartphones used by website visitors. The image below clearly tells us that the performance portion of this website needs improvement. You shouldn't be satisfied with less than 85.

Let us know how your web presence fares in these three categories. If you have any questions feel free to schedule a 30-minute consultation with us using this link.


